
I’ve been a fan and heavy user of the Pocket app for a long time, but one good-to-have feature that is missing is Reading stats. Pocket doesn’t allow users to look at their reading stats directly so I looked up some resources on how to extract data using Pocket’s API.
It took me an embarrassingly long time to do this so I’m surprised no one has come up with a plug-and-play solution yet. I did find something but it wasn’t up to the mark. You can check that out here – http://myreadinghabits.com/
Let’s get to the stats.
| 2017 | 2018 | |
| Number of articles added | 2014 | 2436 |
| Number of articles read | 870 | 1080 |
| Number of articles favorited | 25 | 1118 |
| Word count (average, read) | 1233 | 1362 |
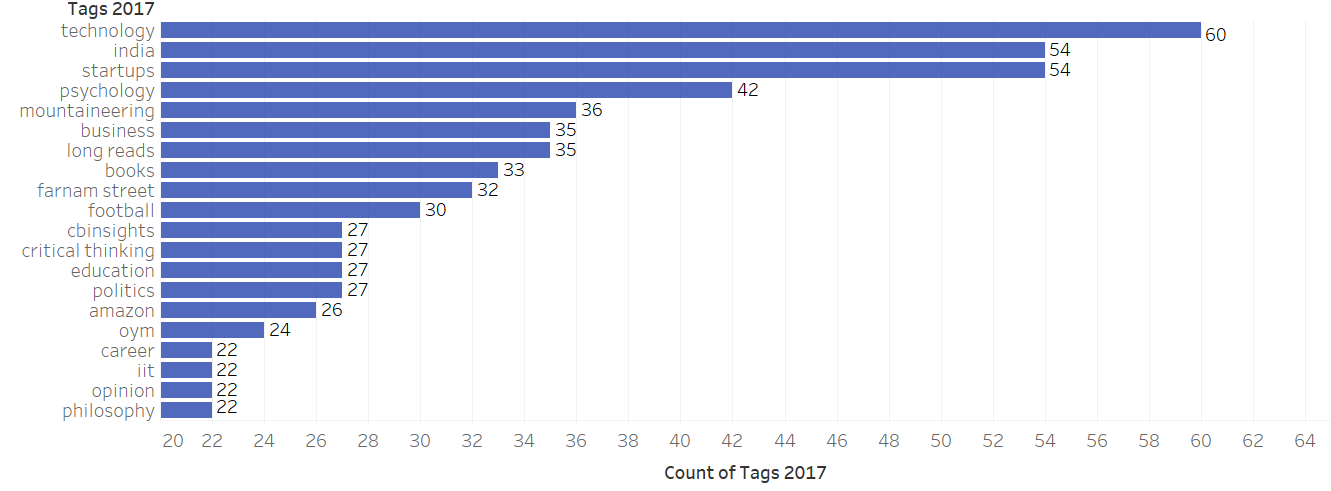
The trickiest bit of analysis here was the one on tags associated with each article. The JSON from pocket was nested 5 levels deep and a bit difficult to manipulate for someone who’s never used Python before.
Top tags from 2017
Top tags from 2018

I also made word clouds using this free website. https://www.jasondavies.com/wordcloud/ Super easy to work with.
Word cloud for tags from 2017

Word cloud for tags from 2018

That’s all folks!
If you want to learn how to extract your data using the Pocket API, here’s a good primer: https://www.everydayplots.com/reading-habit-analysis-pocket-api-python/
For flattening your JSON and creating a pandas dataframe out of it, you can refer to this: https://pandas.pydata.org/pandas-docs/stable/generated/pandas.read_json.html
